Numerical Simulations
|
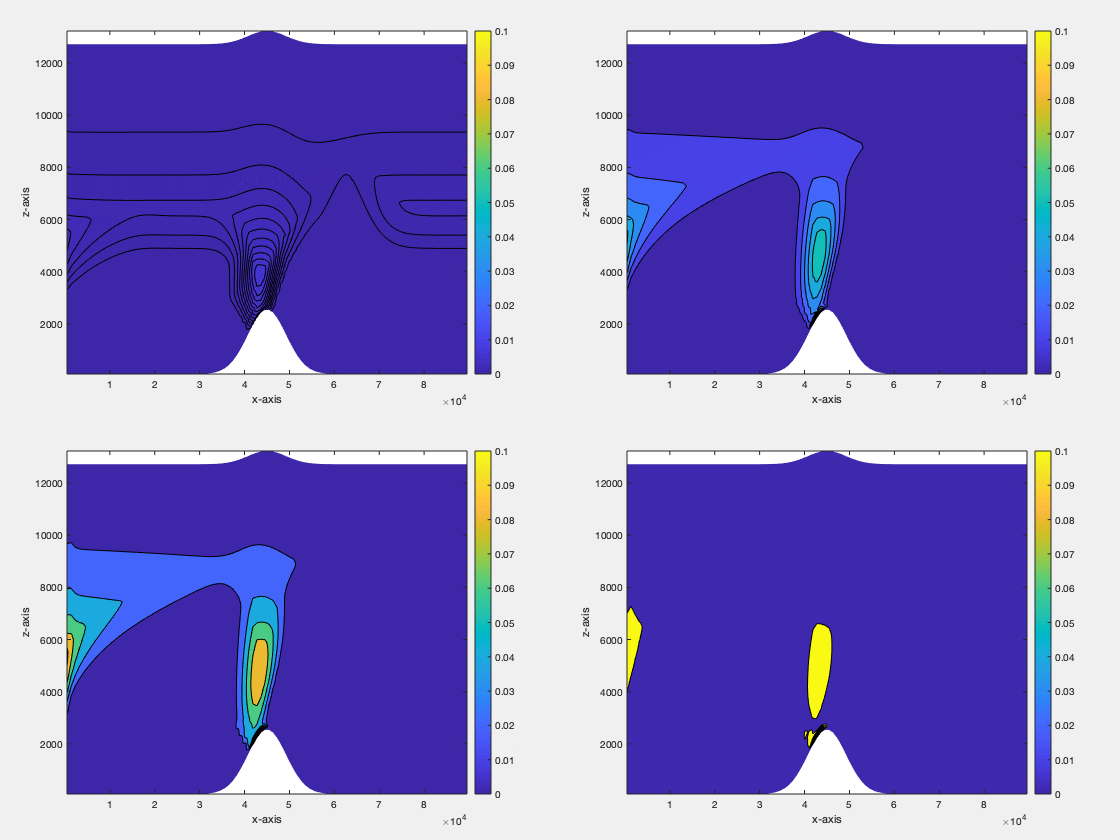
Snow in the Atmosphere Above a Mountain We predicted the snow amount in the atmosphere above a mountain using primitive equation models. In the contour plots on the right, the brightness indicates the intensity of snow. The area with brighter color (toward the yellow end on the colorbar) receives more snow. Four time points are shown here in the figure. |

|
|
|---|---|---|
|
Conservative Numerical Schemes with Optimal Dispersive Wave Relations – Part II. Numerical Evaluations |
||

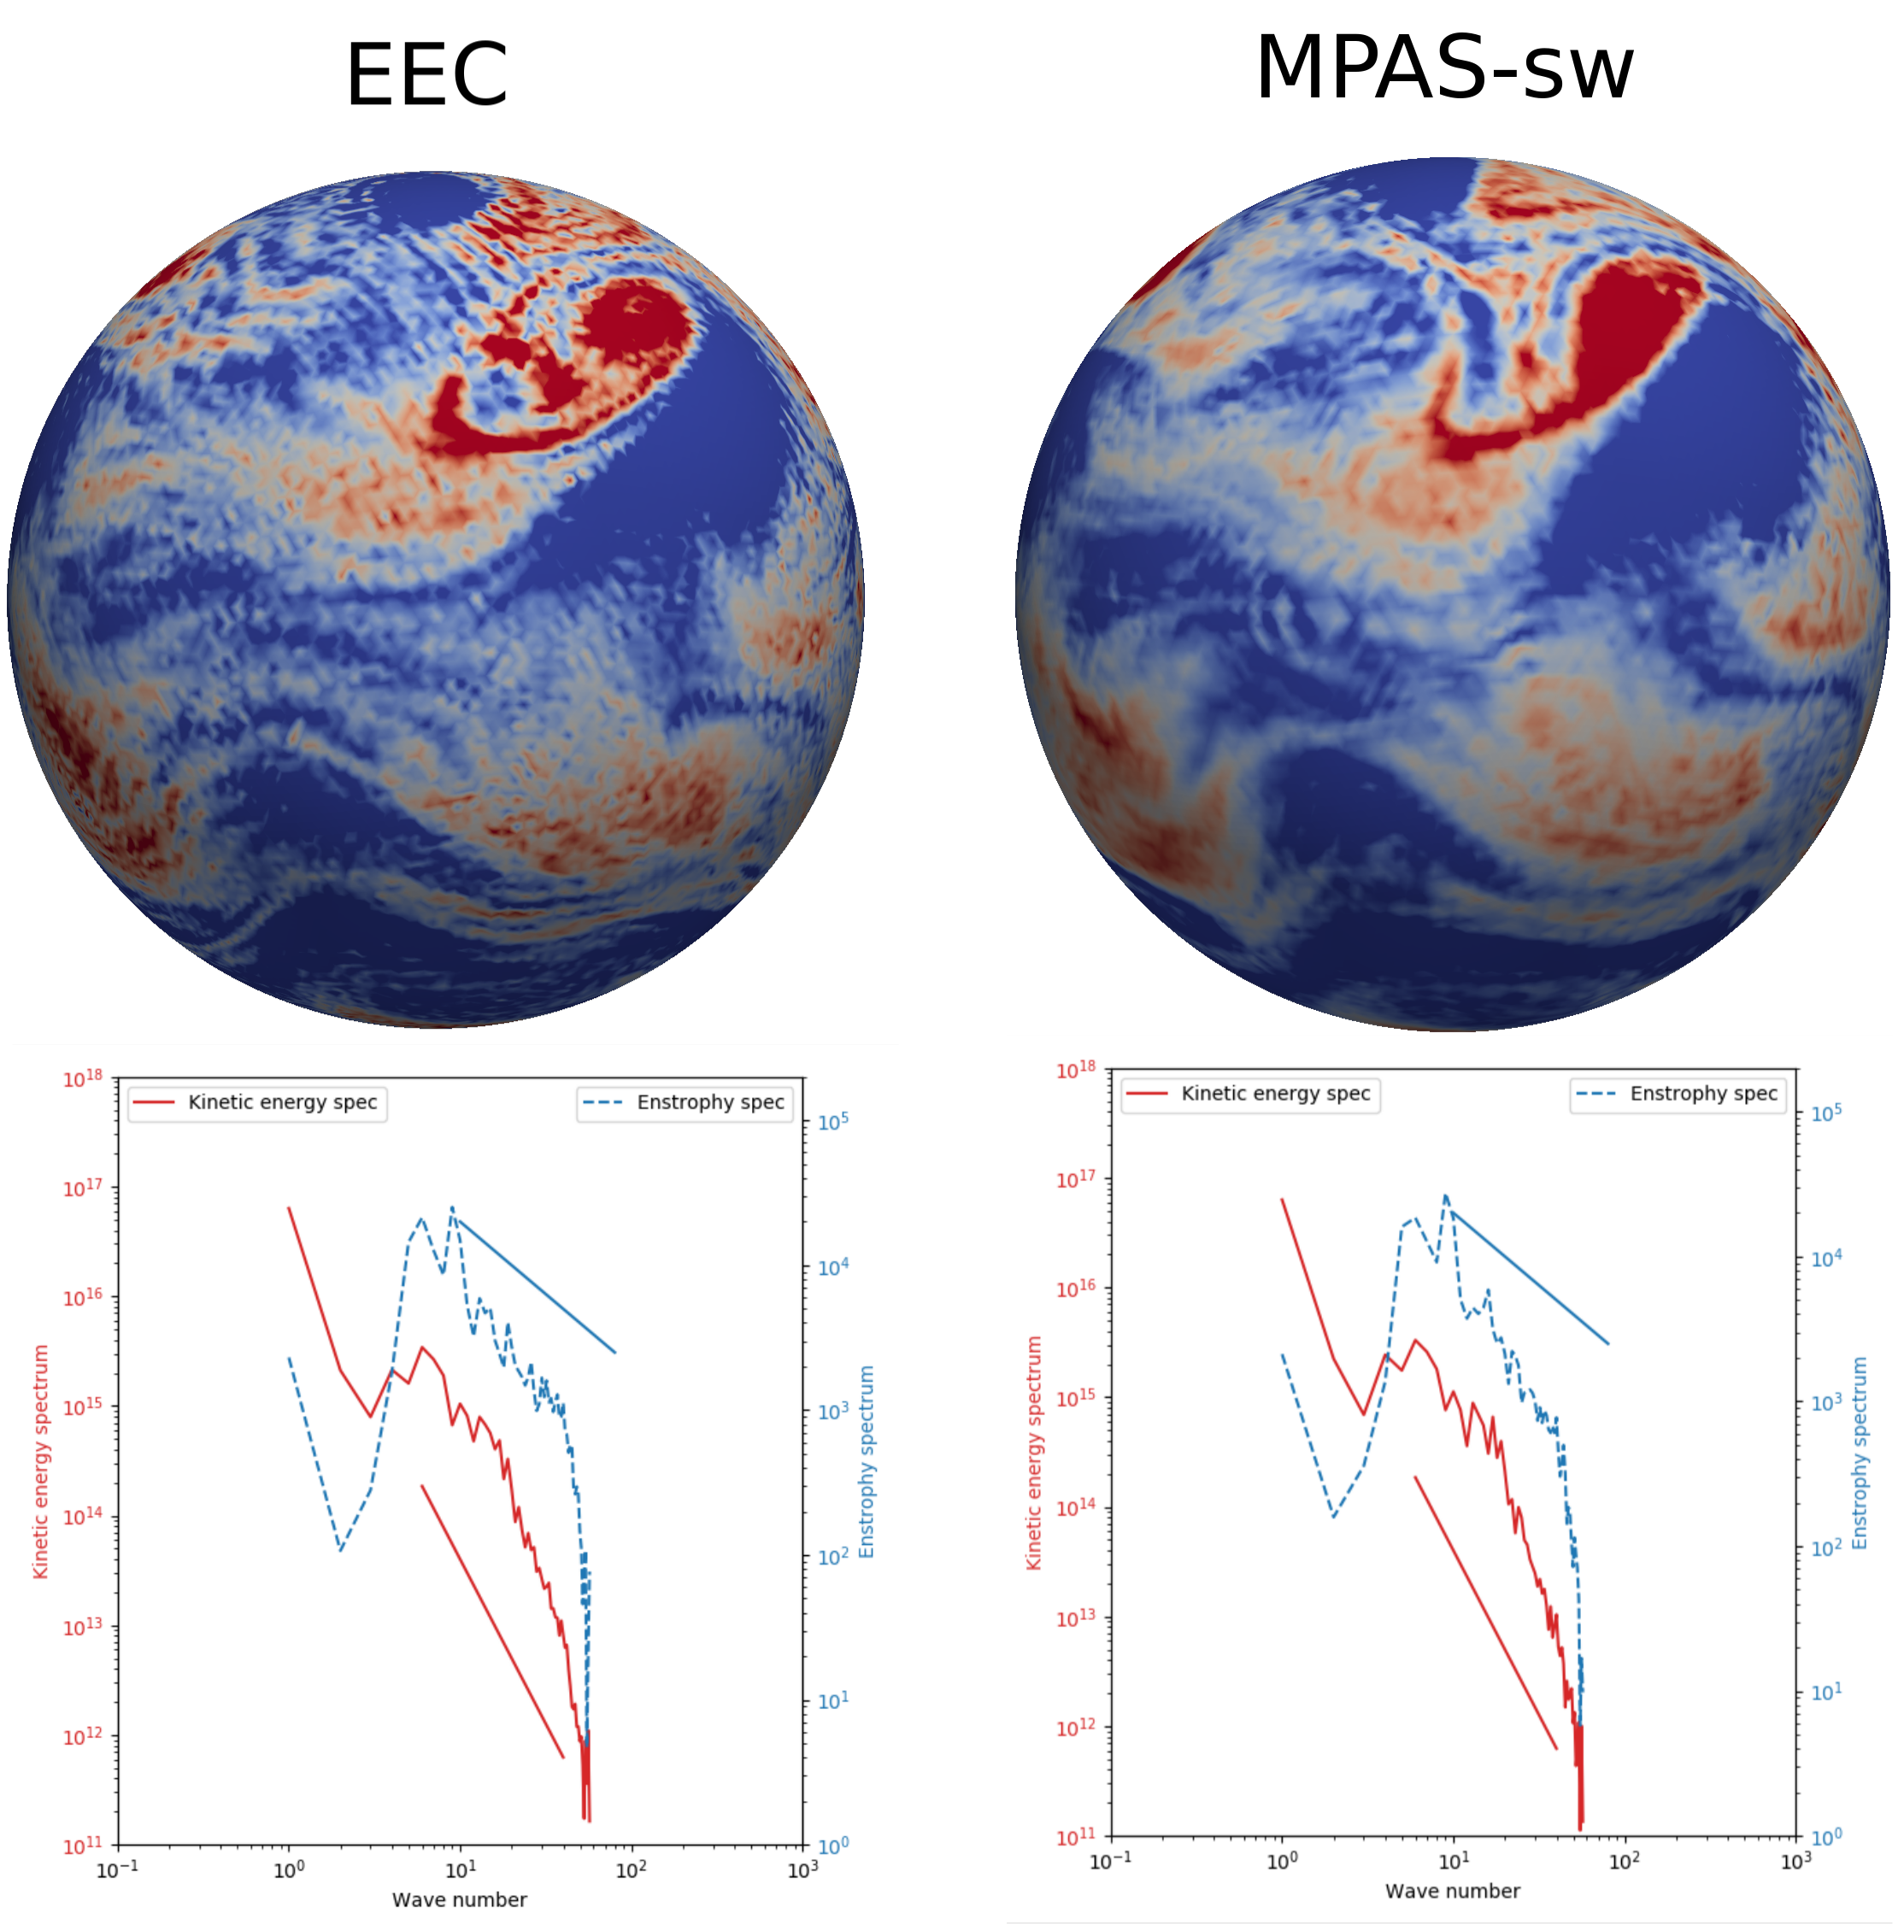
Turbulent flow over a mountain topography on day 50, as simulated by the EEC (energy-enstrophy-conserving) scheme (left panel), and the MPAS-sw model (right panel). Credit: Chen, Ju, and Temam, article in preparation.
|

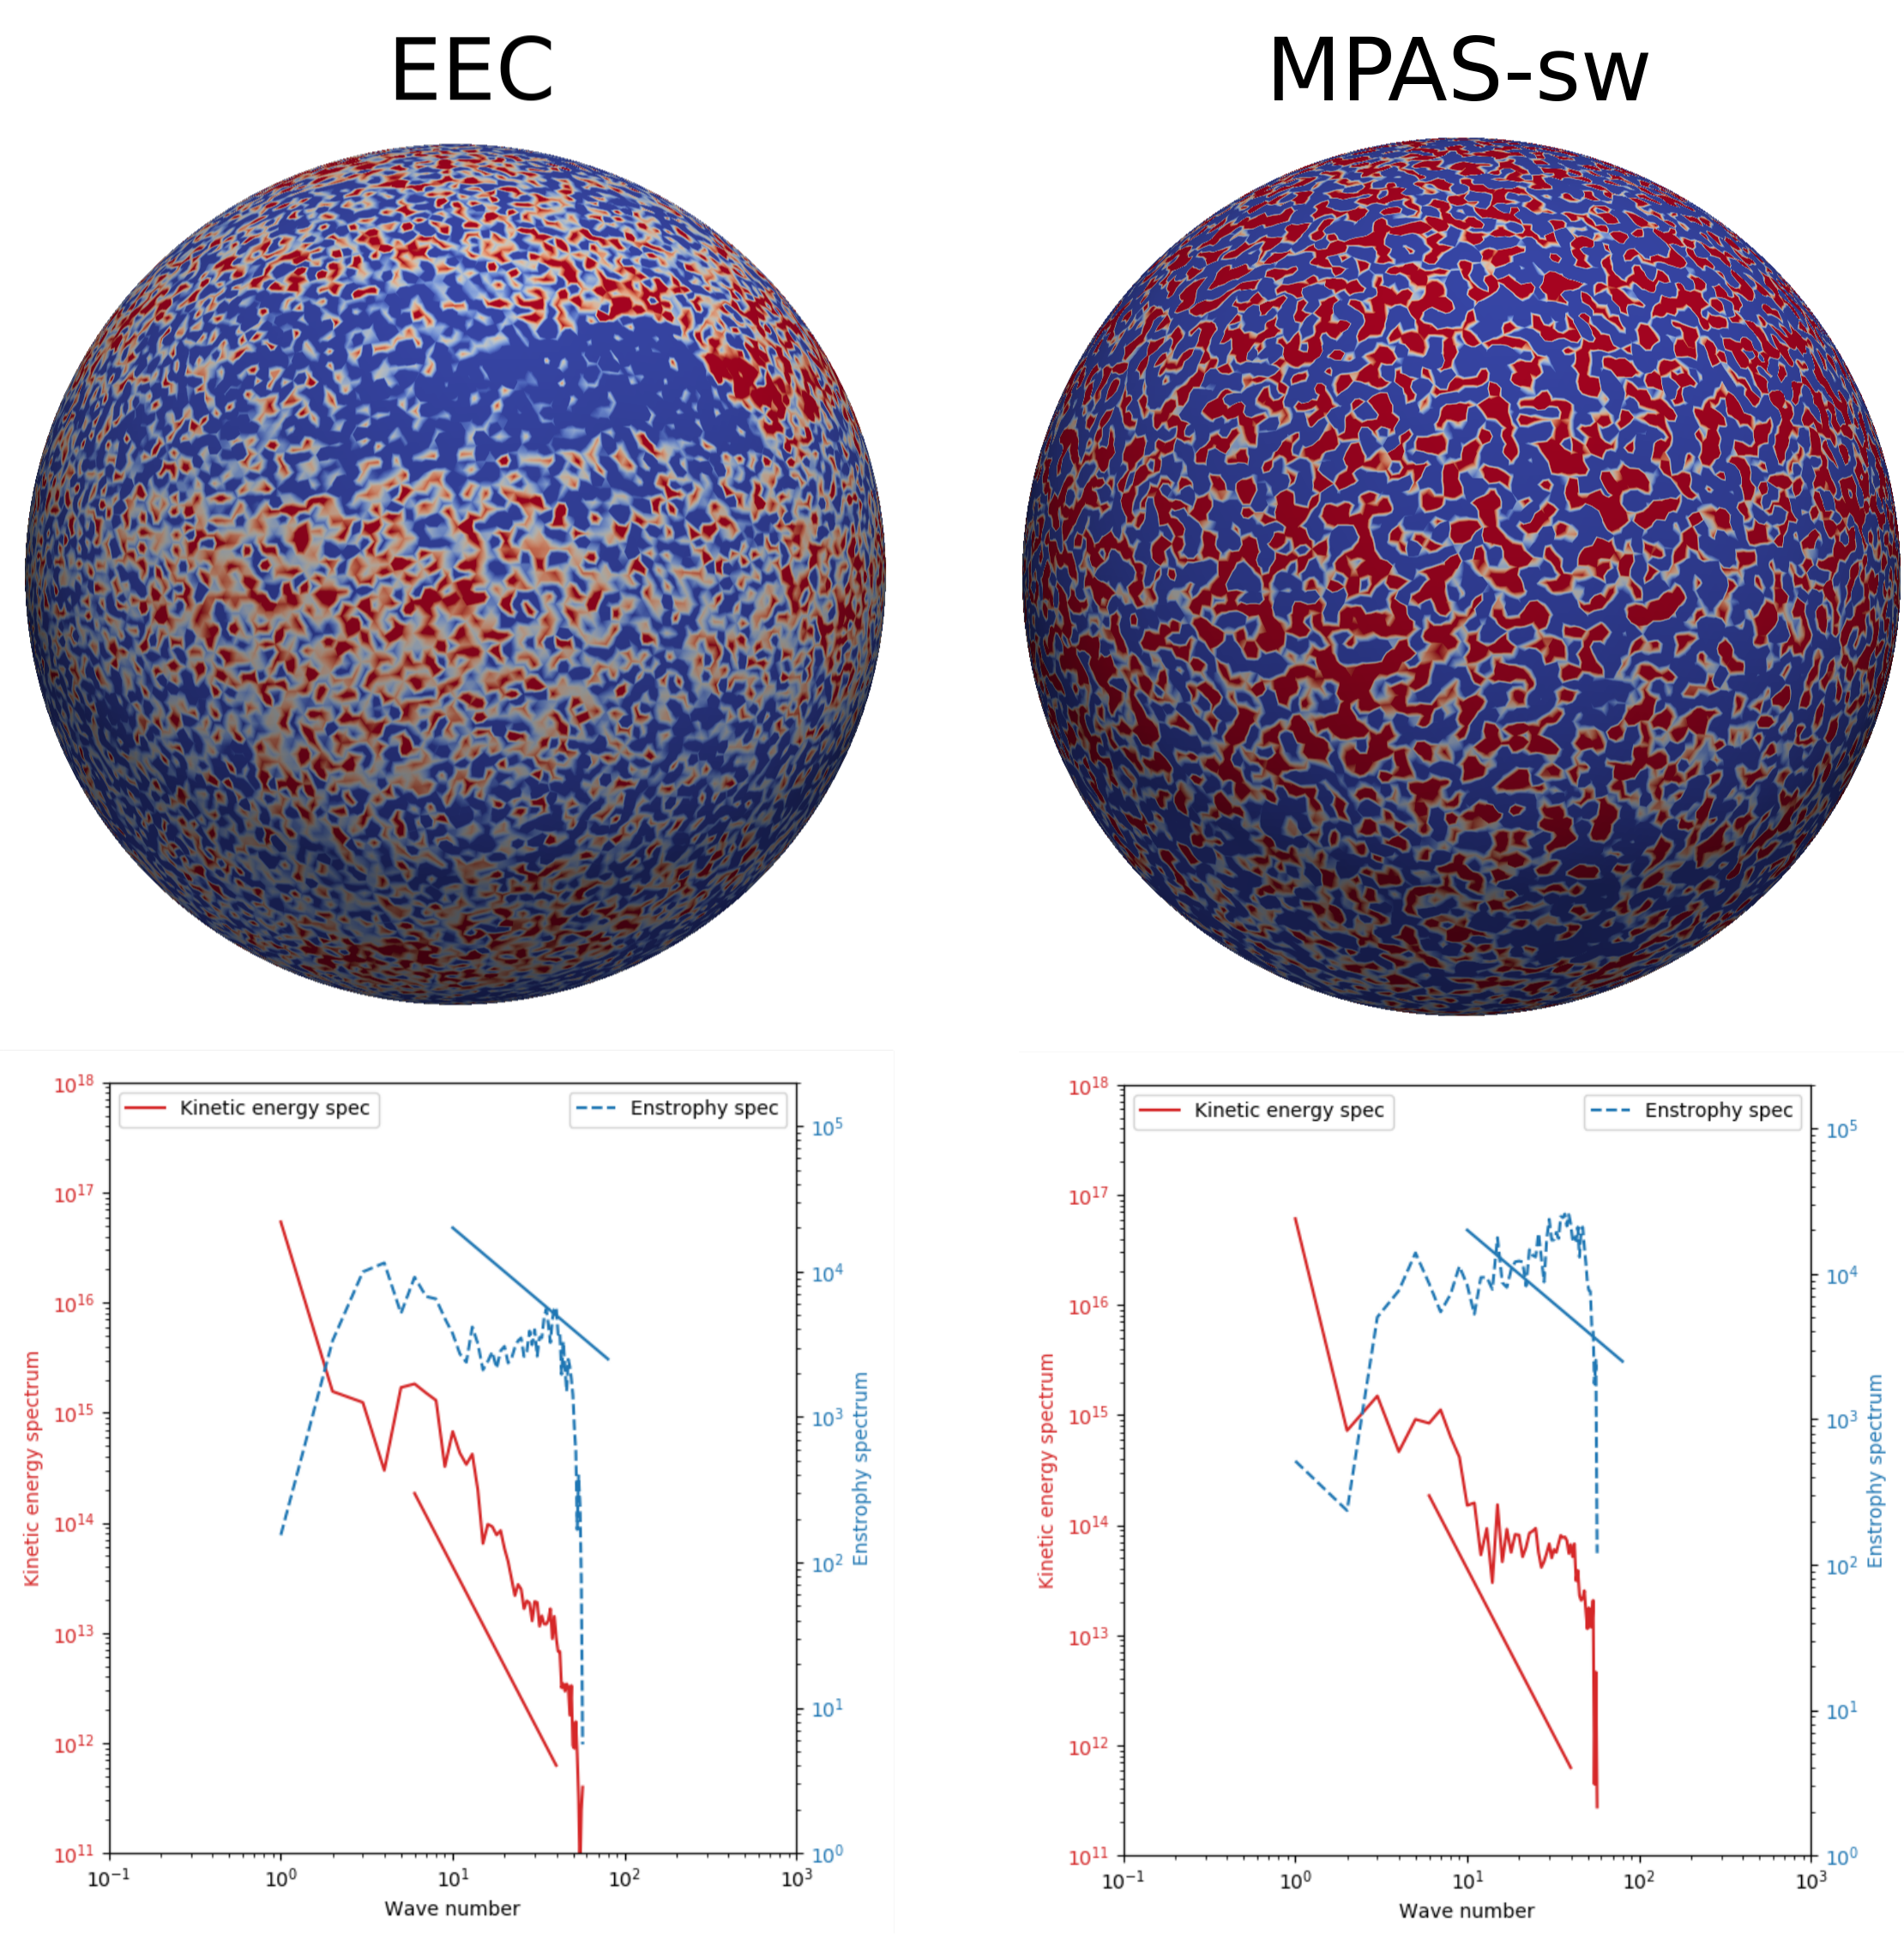
Turbulent flow over a mountain topography on day 250, as simulated by the EEC (energy-enstrophy-conserving) scheme (left panel), and the MPAS-sw model (right panel). Credit: Chen, Ju, and Temam, article in preparation.
|
|

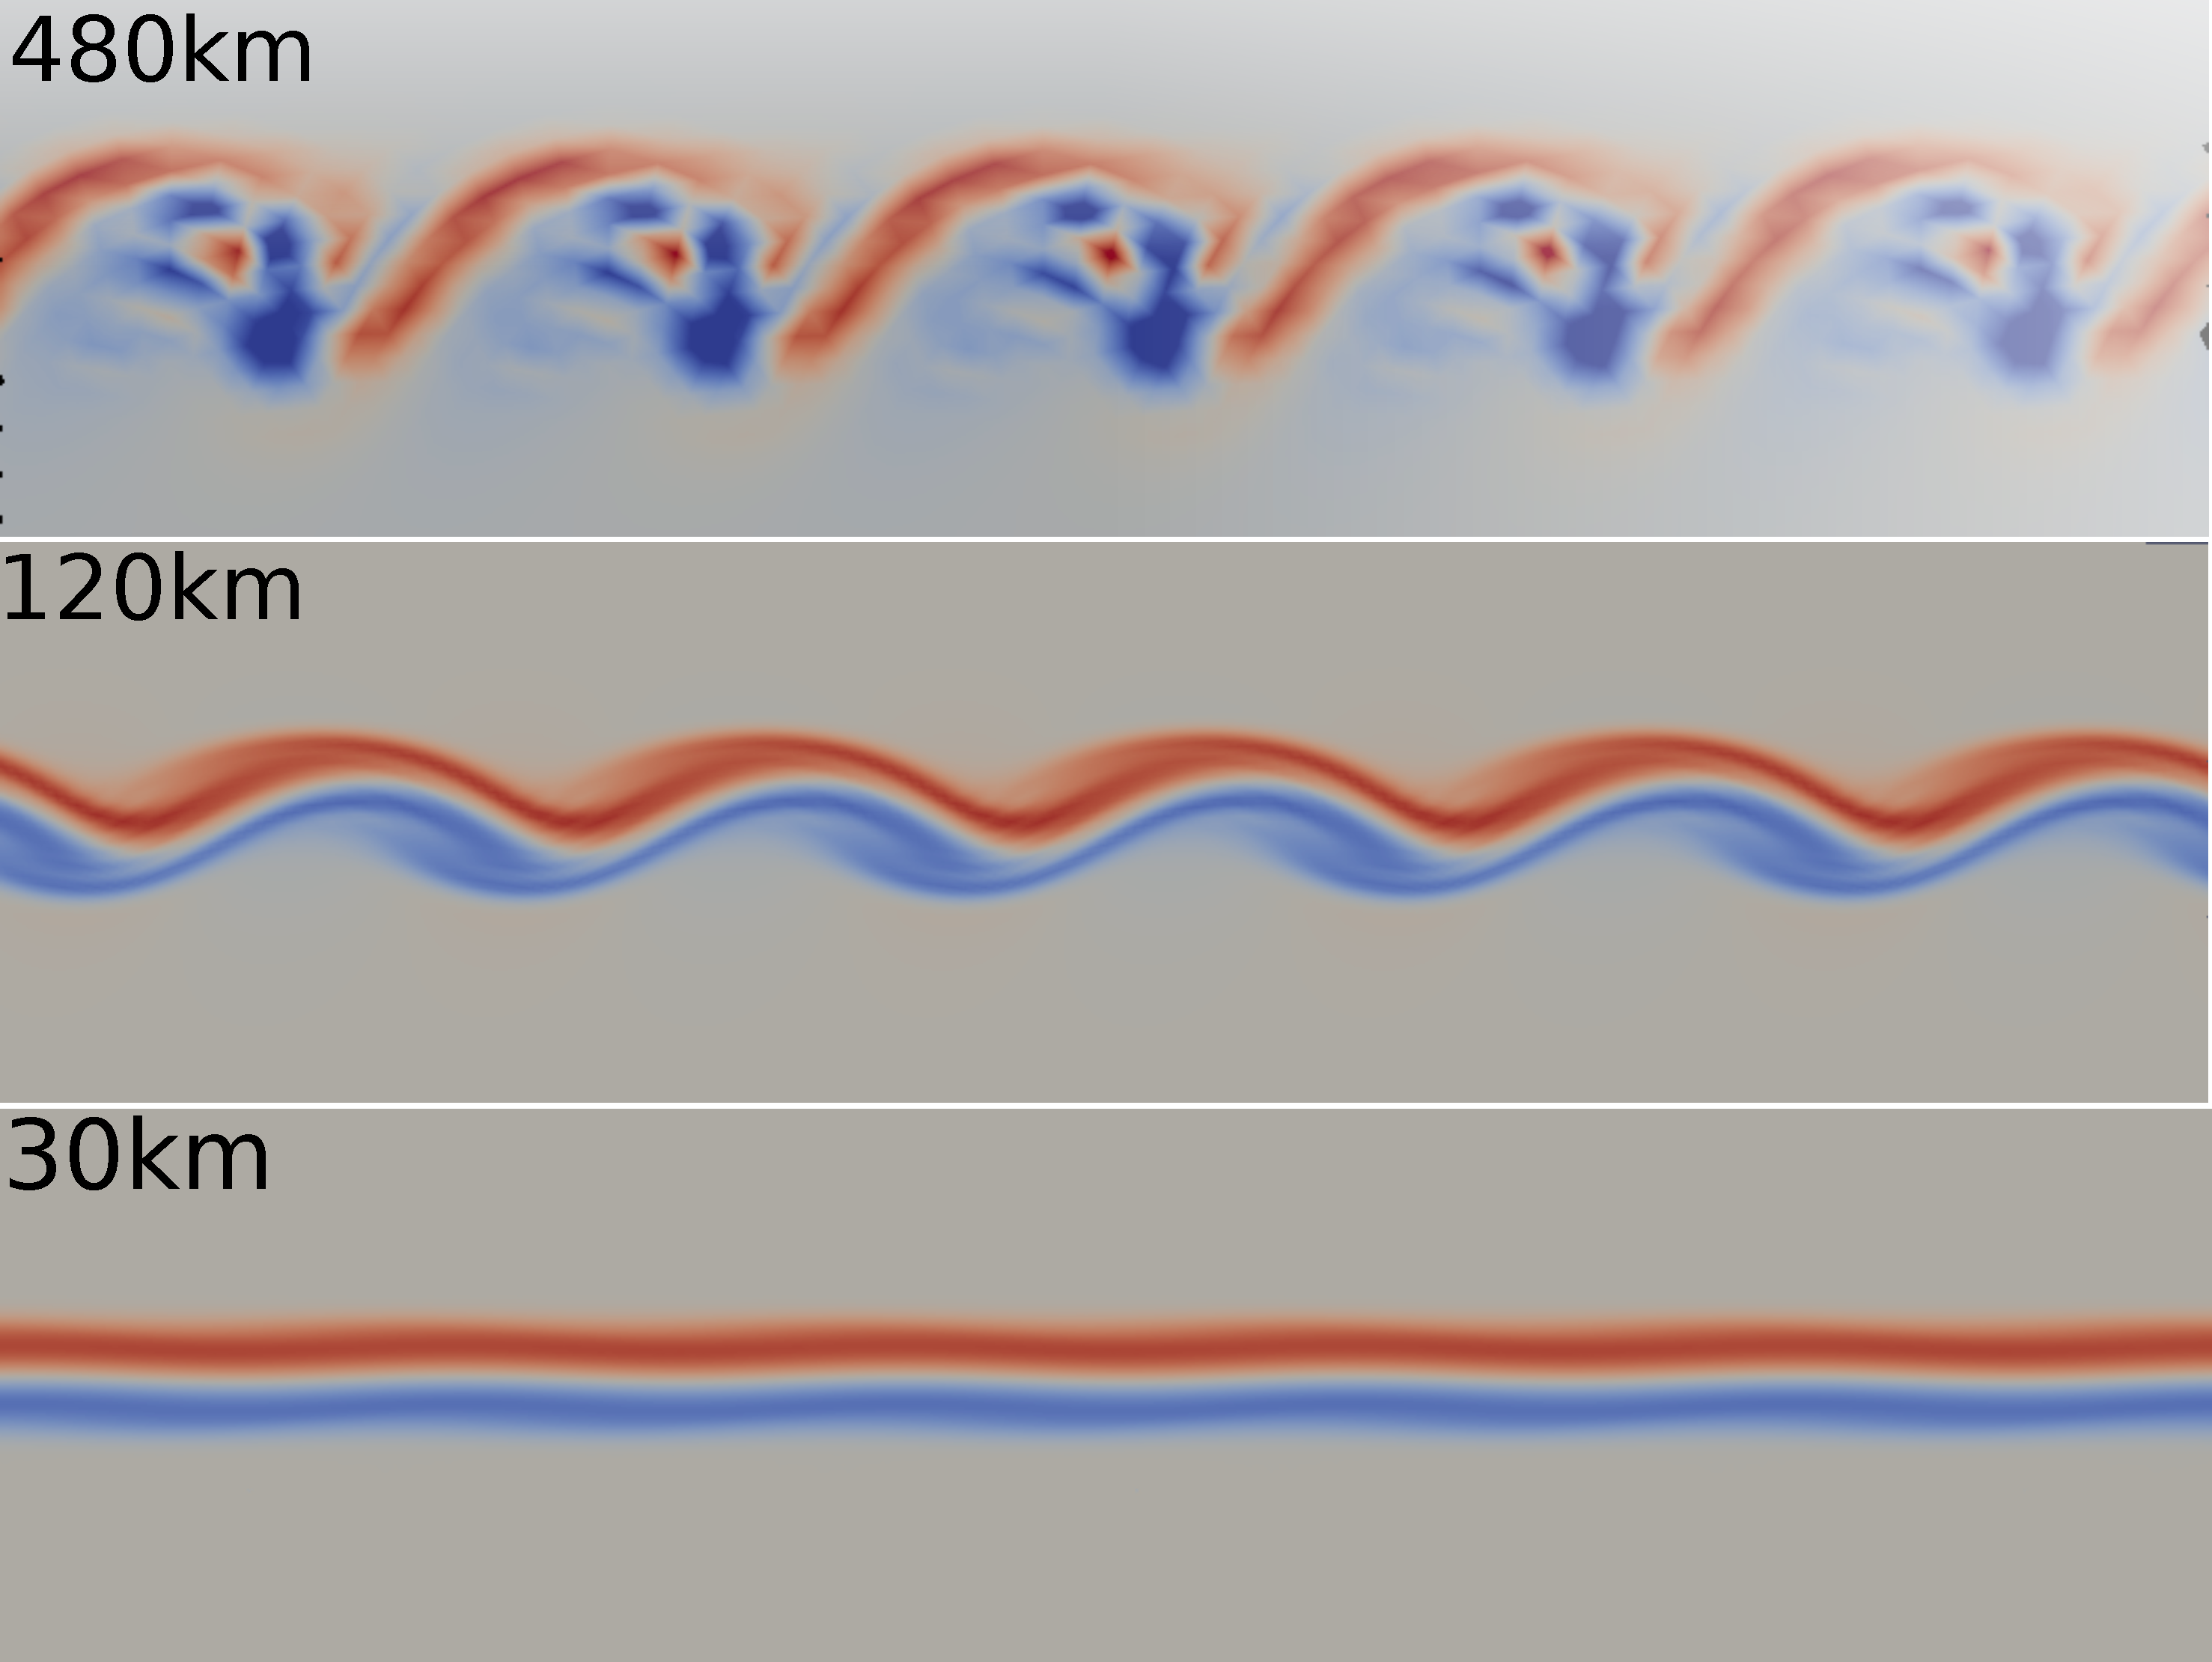
Development of a barotropic instability at different grid resolutions |

Development of a barotropic instability in the viscous and inviscid cases |
